Programs are visualized by portraying their algorithms or data structures.
Whereas the software diagramming techniques discussed above are often performed
in the initial analysis and design stages of a project, program visualization
is intended for use once an application is already built.
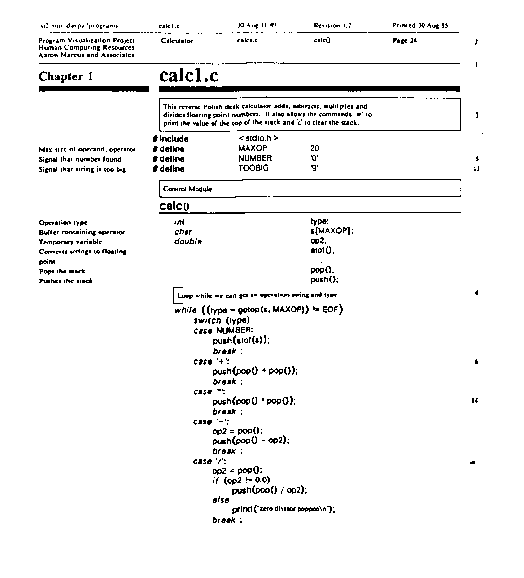
One typographic convention used in writing code is the indentation of nested code blocks. Programmers tend to indent differently. Utilities have been created that produce a standard indentation model, clarifying or at least standardizing the structure of the source code. Baecker and Marcus(1986) takes this a step further with a system called SEE, which typesets the source:
Figure 2.37. Typeset source code. From Baecker (1986).
The system uses typographic rules to separate portions of the code,
and uses multiple columns to differentiate comments from program statements.
It also makes use of graphic symbols to call attention to anomalies such
as early returns from functions. We classify this system as textual verging
on the diagrammatic.
TFPDRAW (Matsumura 1986) is more programmatic than a typesetting system,
but is not quite a programming language by itself.
Figure 2.38. TFPDRAW. In Matsumura (1986).
It can be seen from the diagram that program text is still written.
However, the text is highly structured, with sequential, repetitive, and
branching represented with lines ending in rectangles, semi-circles, and
triangles, respectively. Each module is required to be less than 50 statements,
so all modules appear on a separate screen or page.
The modules themselves are displayed in a module-relation diagram that
used the same format as the design diagram. Modules can be of three types
- process, data, or package, and these types are indicated by shape. The
limitation of 50 lines per module is logically artificial, but psychologically
sensible, as it allows the programmer to get an immediate understanding
of the module in one glance.
Incense (Myers 1983) is a system working on top of Mesa. It provides a way for a programmer to define how each data structure will be displayed on the screen. For example, the system displays box-and-pointer diagrams of pointer structures rather than their numeric addresses.
Figure 2.39. Incense. From Meyers (1983).
Incense handles some of the problems of fitting arbitrary structures
onto the screen, and proposes methods for editing of the structures. Arrays,
matrices, and any variety of pointer structures are all displayable. Size
is used as a sort of logical proximity indicator - the farther down the
list, the smaller the elements get. This use of size is a metric rather
than a topological convention.
Kaestle (Boecker 1986) is in many ways similar to Incense. It is built on top of LISP instead of Mesa. Since the LISP cell structure is uniform, the system can automatically generate a visual representation for any data structure.
Figure 2.40. Castle. From Boecker (1986).
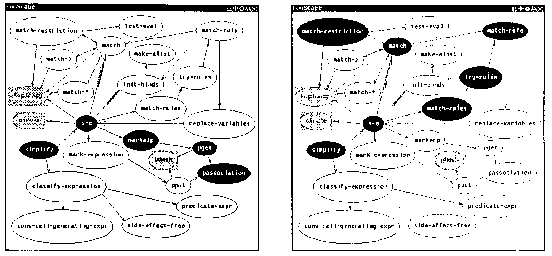
Fooscape, also mentioned in Boecker 1986, operates at the function level. It is described as a landscape of functions:

Figure 2.41. Fooscape. From Boecker (1986).
Its main purpose is debugging. A diagram of functions is displayed.
As each function in a program is fired off, the oval containing the function
changes color. Some of the functions can be marked off as not of interest
(without this feature, a string-conversion function might flicker hundreds
of times for each invocation of a higher-level function). It is also evident
from the above diagrams that a limited number of functions can be represented
on the screen at any time.
Boecker has added an audio dimension to the system by giving a unique
entrance and exit tone to each function. He claims that abnormal behavior
in a program both looks and sounds different from normal behavior.
Organik (1974) discusses the display of contour diagram snapshots of executing programs as a teaching tool. The programmer invokes a procedure call at any point in the program, and a diagram for the current state is generated.
Figure 2.42. Contour diagrams for a code fragment. From Organick (1974).
This system uses all three sets of conventions - tree structures are
represented both as graphs and as containment diagrams, and memory is represented
with adjoinment conventions.
Pecan (Reiss 1985) is built on top of Pascal. The programmer sees multiple
views of the program. These include
source
expression display as a tree
flow graph display
NS diagrams
symbol table
datatype definitions
stack
interpreter output for debugging
Both the flowgraph and the source highlight as the program is stepped through. The stack is displayed as the activation record of the particular part of the program that is executing.
Figure 2.43. Pecan. From Reiss (1985).
The contribution of this work is in the strong implementation of multiple
views, where a program can be simultaneously seen in a number of different
representations. The conventions used are text, graph-based, and containment
based. In a certain sense, all windows-based system make use of the containment
metaphor, as a window is a rectangle that is perceived as containing a
viewpoint and state distinct from all other windows.
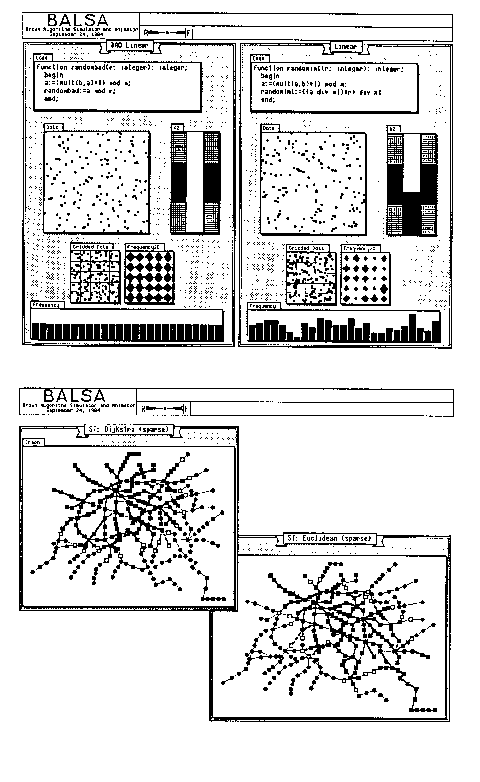
The Balsa system (Brown 1985, 1987, 1988) was constructed as a teaching tool. It elaborately animates algorithms.

Figure 2.44. Balsa. From Brown (1987).
An impressive piece of development, it uses both topological and metric
conventions in representing program activity. Many of the outputs of the
system are histogram-like in nature, intending to demonstrate the differences
in effectiveness between alternate algorithms. Brown claims the system
has helped computer scientists discover flaws in widely used algorithms.
In order to accomplish the animations, subroutine calls are injected
into the program that control the animation. Brown refers to these injection
points as interesting events. Freezes in the animation can be programmed
in, so that the viewer is prompted in order to continue viewing the animation.
The tool requires work from the programmer to decide what parts of the
algorithm should be visualized and how the algorithm should be seen.
Perhaps the biggest contribution of the work is its demonstration of the power of animation in teaching how programs work:
Figure 2.45. Balsa animation example of a Vornoi diagram algorithm. From Brown (1987).